


Have you tried to add an Einstein Analytics dashboard to your pages in Salesforce Lightning?
Embedded dashboards display Einstein Analytics data to your users where it matters the most – there’s no need to navigate to a separate application to surface these powerful reports.
I must admit the product team have done a brilliant job enabling users with Analytics and integrating the Einstein Analytics product with the Salesforce ‘core’ products (ie. the force.com, think Sales Cloud and Service Cloud). The ability to embed Analytics dashboards was another recent eye-opener for me of Einstein Analytics. I knew this embed ability existed but I hadn’t played with it much, and so, I want to share with you just how easy it is to do!
Steps to Embed Analytics Dashboards in Salesforce Lightning Pages
- Navigate to your home page or a record page for the object you want to edit. Go to the top cog icon and just click ‘Edit Page’.
- The App Builder is magic! Drag the component ‘Einstein Analytics Dashboard’ and select which active dashboard you want to display…it couldn’t be easier!

Here you can see in the app builder the account page, with the compact layout section at the top, followed by an embedded Einstein Analytics dashboard.
And below you can see closer up the dashboards details displayed just for that account with a range of filters that the user can select from , such as the toggles on stage (Open, Won or Lost) and other filters such as Rep, Type and Close Date.

Let’s say that this speed and ease is characteristic of the Lightning Experience. The Lightning Platform is much more than a user interface! The modularity of the underlying tech makes it easier to build responsive applications for any device, including an out-of-the-box set of components, event-driven architecture, and a framework optimized for performance.
Tips for Embedding Analytics
1. Make the Dashboard Record Specific
You can present a dashboard as it is let’s say in the home page, for all opportunity details across your Salesforce org. But at times you may want to have the dashboard to display data only relevant for the record you are in. As we did in our previous example there is the opportunity dashboard filtered by matching the account name.
2. Take Advantage of Filters
You will have all variables available from your data set to choose from. You can also add more than one filter, for example when the opportunity name equals the opportunity that the user is in AND when the stage is not closed.
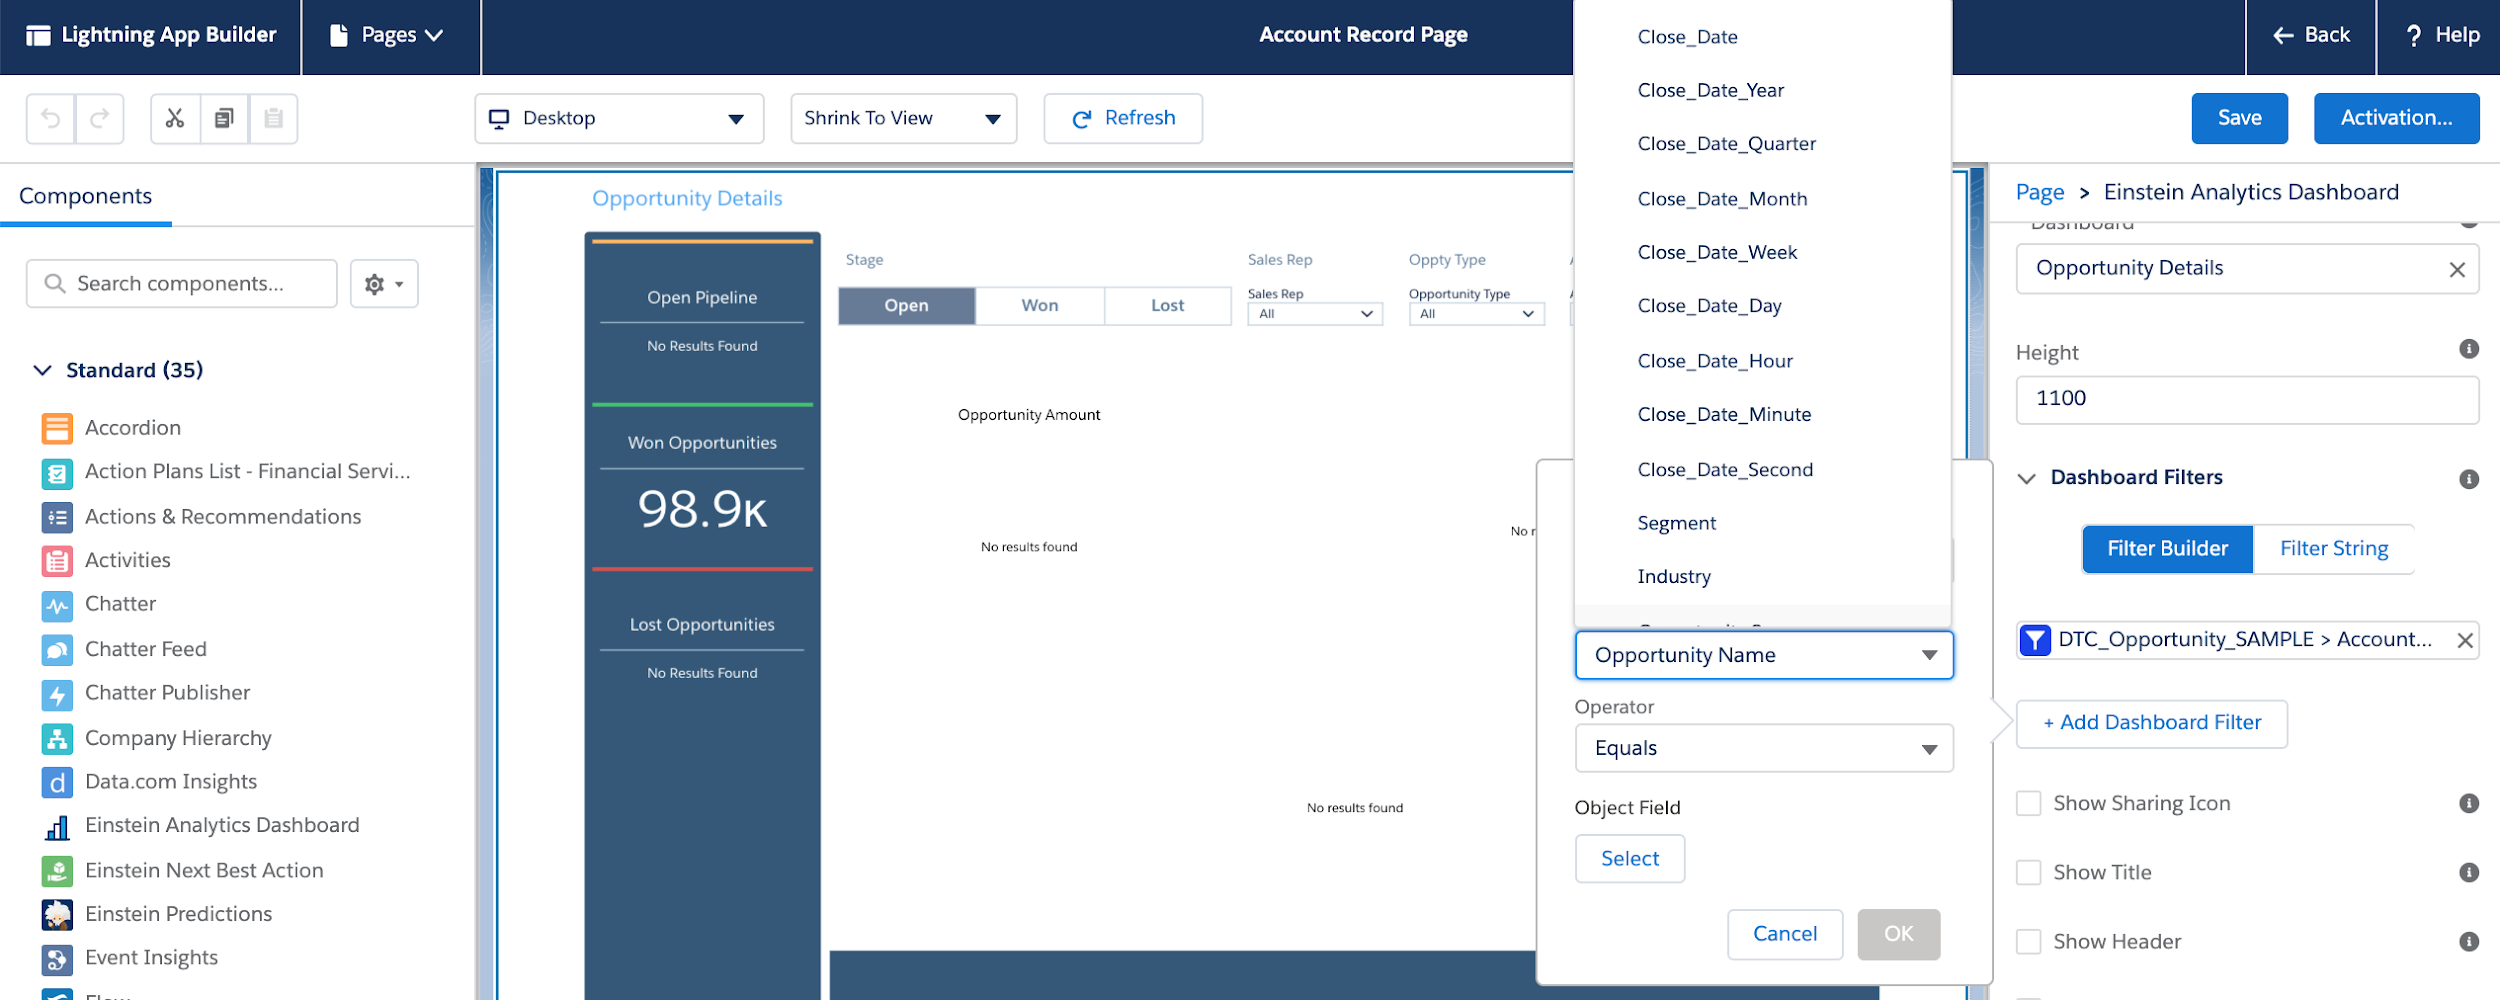
As you can see in this example: you can filter by the name of the opportunity or by the segment or by any of the options displayed.So you can forget about creating rollups or crazy fields populated by automation, just simply filter by dynamic date range fields.
Or filter by type of open opportunities so that the account team can at a glance get ready for their next face to face meeting with the customer.
3. Don’t Forget to ‘Set Component Visibility’
Remember, you can set a component’s visibility not only by the user’s profile who is viewing the page, but also using field data from the record itself.
For example, if you have a dashboard of insights on previous renewals, you may want to exclude showing the renewals component on the Account pages where there hasn’t been a ‘Closed Won’ Opportunity yet for that account.
Another example is to show a component containing a general dashboard, but showing only records that have something in common with the record you are viewing, like a dashboard showing all Closed Opportunities in the past year which have the same industry and country are the same as the current Account record you’re viewing. The account team gets contextual guidance for the next steps they could potentially take.
Bonus: Hide on Error
Oh and one more on this, just on top of the ‘Set Component Visibility’ Option you have a very useful checkbox as you can see below with the label of ‘Hide on Error’, use it!

Summary
The Einstein Analytics Product team has made it very easy to add the visualisations in core Salesforce aka to embed Einstein Analytics dashboards.
Similar to regular salesforce reports you can make Einstein Analytics dashboards when embedded in core Salesforce specific for the record the user is looking at, you can use filter conditions and set component visibility to show only when most relevant.
Do you have any embedded analytics already in your Salesforce org? Tell us here in the comments section how it is helping you and your organisation!
And of course if you haven’t had the chance yet to play with this, there is a Trailhead module on this to get your hands on it! Check it out:

Comments: