As a long time advocate of Salesforce Lighting Experience, it sometimes still feels like an uphill battle to convince users and admins alike that Lighting is awesome. I genuinely really like the look and feel of the UI, as well as the advanced declarative options it has to offer. On the Salesforce Ben blog, we recently explored the idea that with additions in the Spring ‘21 release such as manual sharing, Lightning is now comparable in functionality to Classic, and there’s never been a better time to make the move.
As much as we love Lightning and want you to love it too, there’s no getting away from a topic that comes up over and over again…load time. We heard you, you think the load time for Lightning is way too slow. Good news! Salesforce heard you too and they added the ‘Analyze’ button for Lightning page layouts.
In this post, we’ll dive into how you can use the ‘Analyze’ button to improve your Lightning page loading speed.
What is the Analyze button?
The ‘Analyze’ button is available within the Lightning App Builder, for both standard and custom objects, and analyzes the fields, instances of the Related Lists component, and metadata of a record page.
The ‘Analyze’ button will provide a predicted page load time for desktop and a page performance index for mobile, as well as best practices and suggestions for improving page load time for a better end-user experience. From the Winter ’22 release, page analysis will now run automatically, without the need to press the button! If you want to run the analysis manually, you simply click ‘Analyze’.
How to Analyze your Salesforce Lightning Pages
Before we dive into how to analyze our pages, let’s take a look at the page I chose to use for this tutorial. I decided to use an Account page layout, however, I messed it up a little bit first to see how smart the analyze button really was. My Account page is now a smorgasbord of components including:
- Highlights
- News
- Tabs inc. Details, Related Lists, News
- Related List Quick Links
- Multiple Related List – Single
- Activities timeline
- Chatter
- Report
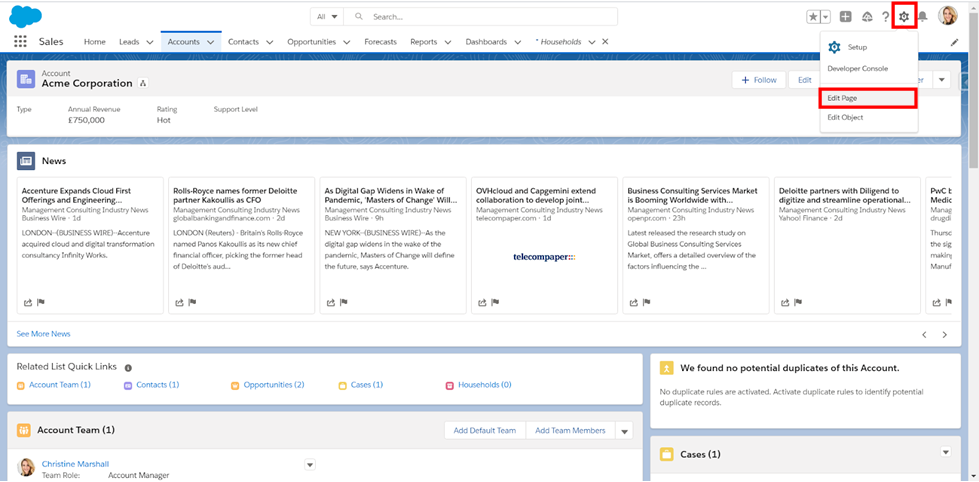
If you want to play along, open up your best or worst Lighting page layout, click on the cog, then select ‘Edit Page’.
You’ll be taken to the Lightning App Builder, where you’ll find the analyze button in the top, right hand corner. It should run automatically, but if not, click ‘Analyze’ and you’ll get instant recommendations!
Results can be broken down into several sections: Org-Specific Metrics, Desktop and Phone.
Org-Specific Metrics
New from Winter ’22, is the ability to view org-specific metrics! This new feature displays performance metrics based on data collected from the previous 90 days, including users’ browser speed, network latency and number of cores. If I’m being honest, that explanation was a bit techy for me too – what on earth are “number of cores”?!
Browser Speed – Browser Speed can be tested and scores the performance of a web browser by measuring the browser’s efficiency in completing a predefined list of tasks. Browser Speed can be influenced by network equipment such as the router, cables or whether or not you are using WiFi. You can also improve Browser Speed by removing unused extensions or clearing your cache and cookies.
Network Latency – Latency is a measure of delay. Network latency measures the time it takes for data to travel across a network to its destination. Distance can cause issues, for example if the servers hosting your Salesforce org are in a different geographical region to where your users are based/trying to access the data.
Number of Cores – The CPU cores in a user’s computer. Cores affect how quickly data is processed and displayed. Typically, the more CPU cores a computer has, the better the performance.


Source: Let Org-Specific Metrics Guide Your Lightning Page Performance Improvements
Desktop
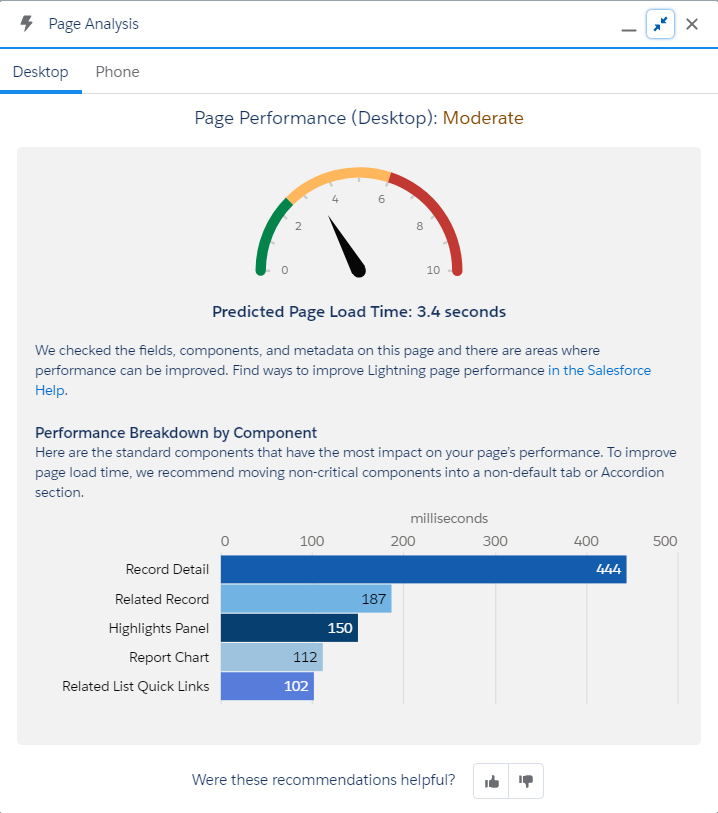
The page analysis displays a predicted page load time of 3.4 seconds, this is moderate performance. It doesn’t sound too bad but every second counts and users (including ourselves) expect everything to be instant, so we definitely need to improve this score.
Page analysis then breaks down the performance by component so we can identify if any in particular are causing big issues.
On my page, the default tab is ‘Details’ which contains many fields and takes quite some time to load. One option might be to choose an alternative default tab that loads faster.
Interestingly, the page analysis for desktop doesn’t mention the number of components on my page layout…more on that later. Overall I felt that whilst the analysis was interesting, it didn’t provide enough in the way of suggestions to improve my load speed.
Phone
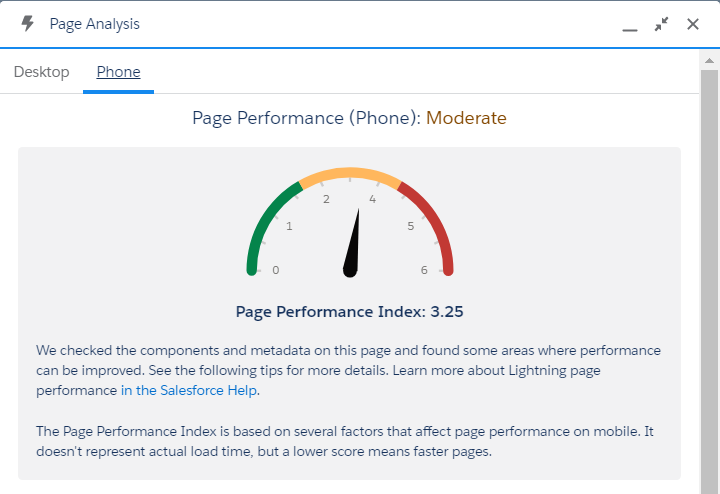
The page analysis for phone (Salesforce mobile app) seemed more comprehensive. My page performance index was 3.25 and although it is still in the moderate category, it is creeping worryingly towards the red zone.
Note: Page Performance Index is not the same as page load time but a lower score does equal faster load time!
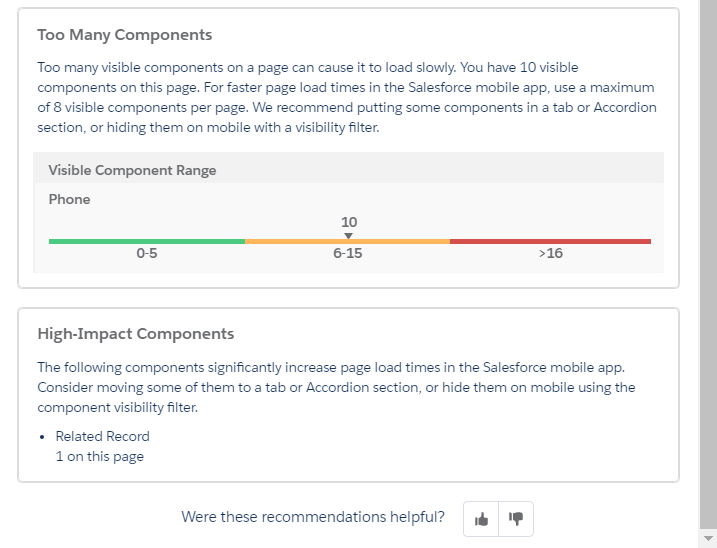
The phone page analysis offers additional recommendations to improve my load time, stating very clearly that the number of components is too high; I have 10 visible components and it should be less than 8. It’s evident from the analysis that 0-5 visible components would be optimal for mobile performance.
The analysis also flags a component that will cause significant issues in performance on the mobile app.
I still feel like I need more guidance on how to optimize my Lighting App for better page performance and load times. Luckily we can use ‘Tips’ in addition to the ‘Analyze’ button to get some additional support!
Salesforce Lighting App Page Admin Tips
Tips work hand in hand with the analyze button to provide clear guidance and best practice. When I navigated to Tips, I found more detailed information on ways to optimize my Lighting pages. Salesforce even picked up on the fact that I have multiple duplicate components, and once again, told me I have too many components, affecting the mobile app performance.
What happened next?
I put some of the suggestions from Salesforce into practice to see how much I could improve my page performance.
First, I removed duplicate components, put related lists into a single tab, added any non-essential components such as News into their own tab and removed the ‘Related Record’ component that was causing issues for the mobile app.
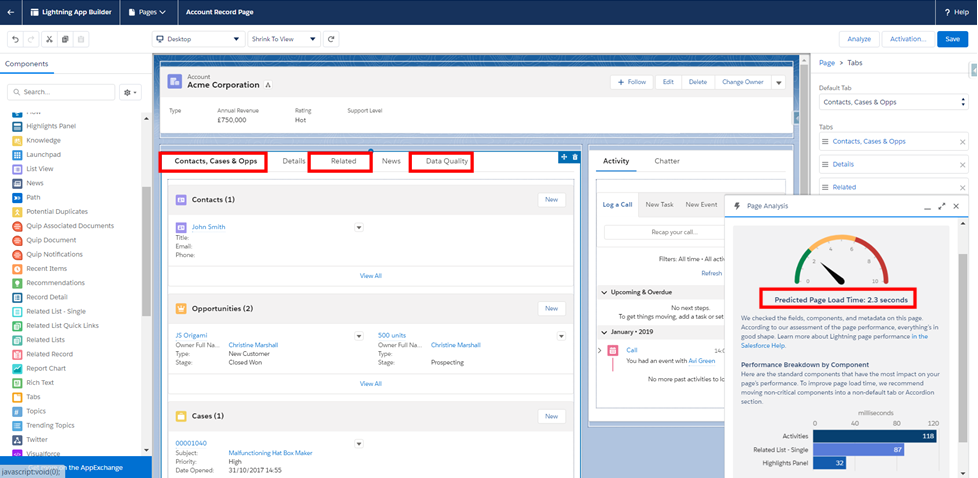
My page layout looks a lot clearer and my predicted page load time for the desktop has improved to 2.2 seconds, while the predicted phone performance index is 1.23.
However, it’s clear that my Details tab takes a while to load and my report chart isn’t helping.
Next, I moved my report component into a separate tab, split my related lists into two tabs and changed my default landing tab. The result? My desktop performance got worse at 2.3 seconds to load!! Although my mobile performance did get better…
I had another go at improving my desktop page performance. I put all my related lists back into a single tab but did not make this my default tab (if I did that my page load time was 3 seconds!).
Even with just 3 related lists in a tab, my performance was impacted so I played around with having Quick Links as my default tab vs a tab with a single related list e.g. Contacts. Both of these options (Quick Links or a single related list tab) reduced my overall page load time to 2 seconds, so they were both viable options. In the end, I decided to go for Quick Links as my default tab as I felt it was more useful.
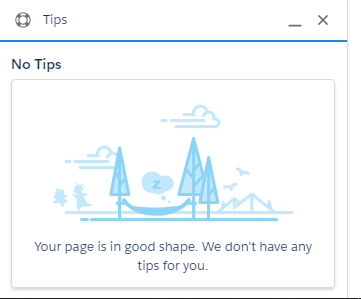
In the end I settled at 2 seconds for desktop page load time and 0.68 for the mobile page performance index. In addition, Salesforce no longer offered me any tips on how to improve:
I know I could have removed the highlights component or put the activities timeline into a tab to improve page performance, but in my opinion, having these components immediately visible is essential and is worth the extra page load time. Let’s be honest, if you put activities in a tab, would your users keep logging them?!
Custom Lightning Component Analysis
Starting from the Winter ’22 release, the ‘Analyze’ button will provide performance predictions for custom Lighting components and display issues and suggestions in the desktop page performance card.
The ‘Analyze’ button will let you know if a component contains things such as external CSS or unminified JavaScript.


Source: Improve Page Performance with More Custom Lightning Component Analysis
Tops tips to reduce Lighting page load time
Here are some top tips to help you reduce your Lightning page load time. It’s worth playing around with various combinations to see what generates the best results!
- Place the Details component in a secondary tab (not the default tab)
- Reduce the number of fields displayed in the details component; if using custom objects consider using Dynamic Forms
- Break up the page using tabs; only the default tab is loaded initially and additional tabs are rendered when selected
- If your page has many related lists, consider placing the Related List component in a secondary tab (not the default tab)
- If both Details and Related Lists render slowly, consider creating an initial default tab with 1 or 2 important Related List – Single components or Quick Links
- Reducing the number of related lists to 3 per tab will improve performance
- Move non-essential components such as News and Twitter into separate tabs
- Remove any duplicate components
- Use component visibility to only display components relevant to each user
- Improve mobile performance by reducing the number of visible components to 8 or fewer; components can be hidden from the mobile from the Lightning App Builder
Summary
The good news is that you’re not alone in feeling like the speed of Lightning Experience could be improved. We know from the True to The Core Live session, that this has been a focus for the Platform product development teams over the past 4 years – and will continue to be (you only need to read the ‘Lightning speed please’ IdeaExchange topic to see how hot this is).
Read more: True to The Core Live: Inside Look into How Salesforce are Developing Salesforce
In positive news, over 4 years, median page load times improved by 60%!
While the Salesforce teams work tirelessly to continually improve speed, as admins we must also do our part to identify how we can optimize our page layouts, following best practice page composition, to improve page load speed.
Resources
Analyze Your Lightning Page Performance
Improve performance and speed in Lightning Experience
Trailhead: Optimize Lightning Experience Performance



Comments: