


Developer Console isn’t just for Developers, it’s a great tool for Salesforce Admins too!
Learn why the Developer Console is a great feature to have in your Admin toolbox to generate logs in real-time, show more detailed error messages, update data issues on the fly, and more. Let’s first introduce at what the Developer Console is and how to access it.
Introductions: Meet the Developer Console
The Developer Console is the native Salesforce “IDE” (integrated development environment).
Great! Wait, what does that mean?
An integrated development environment is a handy user interface that pulls together useful development and debugging tools all in a single place. Think of it as consolidating and extending some of the development and troubleshooting features you usually access via Setup.
The Developer Console can do a LOT of things, but for our purposes, here are the key abilities you want to know about as an Admin:
- Generate logs in real-time
- Show more detailed error messages
- Troubleshoot order of operations issues
- Show when governor limits are being hit
- Explore your data quickly
- Update data issues on the fly
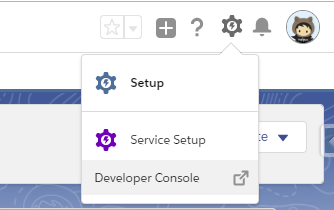
How to Access the Developer Console
How you access the console depends on your UI and your Org, but once the console opens in its own window, the look and feel is the same both in Lightning and Classic.
Lightning Experience
Classic without a Global Header

Classic with a Global Header

Real-Time, Quick Debugging with Debug Logs
One of the powerful features of the Developer Console is the debugging capabilities.
Debugging is the action of finding issues in the system. A debug log is a log of what’s happening in the system, including error messages, automation that’s being triggered, and how close everything is to governor limits.

If you’ve ever scheduled a debug log in Setup, you know how cumbersome it can sometimes be — to go to Debug Logs, schedule the log, log in as the user you’re troubleshooting as, test, log back out, comb through all the logs (you know the pain)….
One of the great things about the developer console is that it starts debug logs for you automatically when you open it. Say goodbye to the days of going and manually setting up your own logs and then realizing they’ve expired halfway through troubleshooting! Developer Console also generates the logs immediately, letting you easily isolate the log you need to look at for any given action.
You can also easily schedule logs for users and then, while you test as them, see the logs generated in real time! You can quickly check the logs from Developer Console and continue testing and troubleshooting as needed. This greatly expedites troubleshooting and makes it easy to isolate issues.
Let’s look at that step by step. Say you have a user named Amy. Amy has complained that she’s hitting an error when she tries to save certain Accounts. Some Account records save fine, but others throw an error. Let’s walk through the steps of troubleshooting using the Developer Console.
Step 1: Open the Console
Open the Console while logged in as your Admin user by following the steps outlined above. A new window should pop open.
Step 2: Troubleshooting
Before you try logging in as other users to test, you can test while logged in as yourself to generate logs. This step is pretty easy, because all you have to do is open the console and it does the rest for you! We’ll explore reading the logs and filtering them in Step 5.

Step 3: Set up a log for another user
Sometimes you have to troubleshoot as another user because you’re unable to recreate an issue as yourself. Here’s how to login as another user (in our case as Amy) to troubleshoot further.
Navigate to Amy’s User record so you can do two things:
- Get her user Id, and
- Log in as her for troubleshooting.
In the Developer Console, click Debug > Change Log Levels…
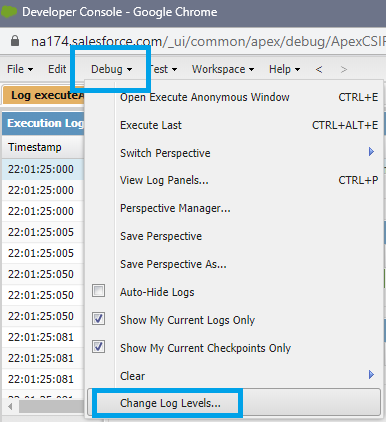
Scroll down to User Tracing for All Users. Click the Add button.

A window will appear. Paste in the User Id of the User you want to debug (in our scenario, Amy’s Id).
Tip: you can get the User Id from the URL of the user record. It will be 15 characters and start with 005.

Almost there! Change the Start Date and Expiration to the start and end times you want by clicking on the fields. Then set your Debug Level by clicking the Add/Change link.

Click Done. Then make sure that the Debug > Show My Current Logs Only setting is unchecked. You want to see all users’ logs when you’re troubleshooting other user’s actions.

Now you’re ready to troubleshoot as Amy!
Step 4: Troubleshoot as another user
Now, leave the console open and log in as the user you need to troubleshoot as (in our case Amy). Even though you’re logged in as Amy, the console will continue to run in your System Admin context, giving you full access to all the debug logs being generated.
Walk through the steps Amy is having issues with to generate the error logs. When you are ready to review a log in the developer console, make sure the Logs tab is selected, then doubleclick a row to open the log you want to view.
Tip: use the Status column to quickly isolate the log with error messages, but remember that sometimes things will silently fail and the log may say Success but there’s actually an issue logged inside.

Step 5: Review and filter logs
Logs can be huge! And they can be tedious to read through. Thankfully, developer console lets you filter and search the logs for specific tags, letting you isolate information more easily.
You’ll notice several preset filters and a freeform search bar at the bottom of the log.

| Executable | Only the lines about automation executing, like flows or code. |
|---|---|
| Debug Only | Show only debug statements (typically in apex code). |
| Filter (and search bar) | Type your own freeform text to filter log, but be careful because it’s case sensitive! |
Lastly, you can customize the columns that you want to view by clicking on the arrow in any column header of the log.

Investigate Data like a Pro with Query Editor
Another way to troubleshoot issues (like the one Amy is having, for example) is to check the data. Maybe it’s not an issue with automation or user mistakes, but a data problem. Developer Console can help with that too!
Step 1: Open the Console
Follow the steps outlined above to open the Developer Console. A new window should pop open.
Step 2: Select the Query Editor Tab

Step 3: Open the Salesforce Object you want to query (no, not in Object Manager)
You could type everything freeform into the query editor, but sometimes you’re not sure exactly what fields you want to look at! Typing them all out is also tedious. Developer Console lets you actually open an object and look at all the fields, then select those fields for your query.
In the Developer Console, click File > Open. In the window that opens, select Objects from the Entity Type list, select the Object in the Entities list, then click the Open button at the bottom left of the window.


Once you have the object open, you’ll see a full list of fields — Standard then Custom — along with the field’s data type. Decide which fields you want to query, hold down Ctrl (Windows) or Command (Mac) and then click to select all the fields. Click Query.

Step 4: Filter your query
If you have more than just a handful of records on the object, you’ll definitely want to filter them out! If you’re new to editing SOQL, Salesforce Ben has a great cheat sheet for you! To filter, you’ll use WHERE followed by criteria. To practice, let’s find Accounts with the Type = ‘Customer – Direct’

Click Execute.

Step 5: Using query output
This is where the fun begins! After your query executes, you should see something like the screen below. Let’s take a quick tour.

- Workspace Tabs: Kind of like Salesforce Console Apps, Developer Console has tabs that will remain open for everything you do or view. You can quickly refer back to your open Objects, compare the results of queries you’ve previously run, or compare debug logs, all in the same console screen!
- Executed Query: This space keeps the query you executed for this tab, so you can always remember the criteria you used to get the output.
- Query Results: This is the actual output of your query, with the fields in the order you queried them.
- Actions: Here you can refresh the query (like refreshing a report) and actually make data changes directly from the console. As long as you have the Id in your query, you can double check on fields and update them via the developer console directly, saving you time performing quick data corrections. (Tip: As a rule of thumb, always add Id to your queries just in case you need to make edits to the records!)
- Access in Salesforce: Here you can take actions within Salesforce. Click on the record you want to access in the query results and then you can open the detail page in Salesforce or jump right to the Edit page. You can also jump to the object’s New page to quickly create a new record.
Keep Learning
This was just a quick introduction to troubleshooting with Developer Console, but there are a lot more things it can do! Trailhead has several hands on modules you can explore to get practice using the developer console. Developer Console Basics and Apex Basics for Admins are both great places to start!

Comments: